

Mathematical model for resistance and optimal strategy
Résumé
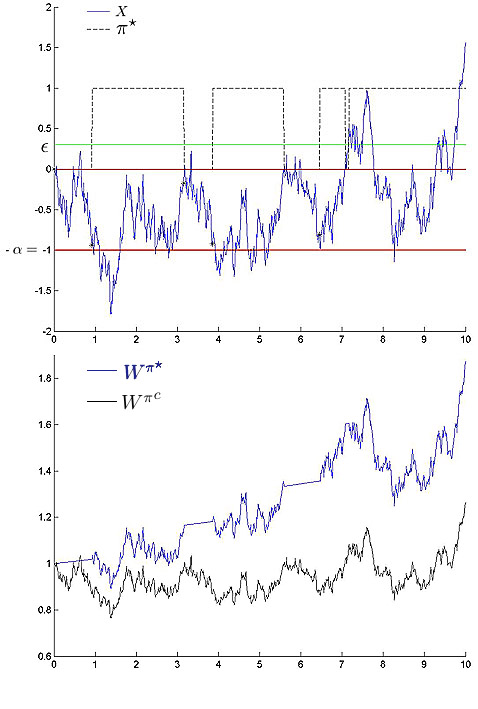
We propose a mathematical model for one pattern of charts studied in technical analysis: in a phase of consolidation, the price of a risky asset goes down $\xi$ times after hitting a resistance level. We construct a mathematical strategy and we calculate the expectation of the wealth for the logaritmic utility function. Via simulations, we compare the strategy with the standard one.
Domaines
Probabilités [math.PR]
Fichier principal
 TechnicalAnalysisHAL.pdf (202.59 Ko)
Télécharger le fichier
technicalcourbes.jpg (88.92 Ko)
Télécharger le fichier
TechnicalAnalysisHAL.pdf (202.59 Ko)
Télécharger le fichier
technicalcourbes.jpg (88.92 Ko)
Télécharger le fichier
Origine : Fichiers produits par l'(les) auteur(s)
Format : Autre
Loading...