

Illustrative Data Graphics in 18th-19th Century Style: A Case Study
Résumé
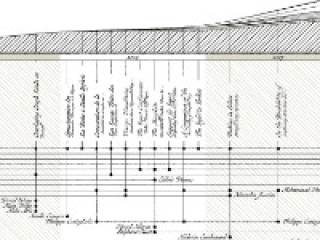
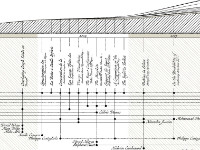
We present a scientific reflection on the creation of a large illustrative personal data graphics that we create to mimic 18th-19th century style visualizations. We discuss the relationship to illustrative visualization, the story-telling aspects of the design, the used data sources and their purpose, the creation of the overall style, and the aspects of the multi-author creation process.
Domaines
Informatique
Fichier principal
 vis2013-jdf-poster.pdf (1.31 Mo)
Télécharger le fichier
vis2013-jdf-poster.pdf (1.31 Mo)
Télécharger le fichier
 Bach_2013_IDG.jpg (15.6 Ko)
Télécharger le fichier
Bach_2013_IDG_Poster.pdf (21.41 Mo)
Télécharger le fichier
Dragicevic_2013_VSI_Poster.pdf (46.88 Mo)
Télécharger le fichier
Dragicevic_2013_VSI_PosterNoFrame.pdf (43.84 Mo)
Télécharger le fichier
Bach_2013_IDG.jpg (15.6 Ko)
Télécharger le fichier
Bach_2013_IDG_Poster.pdf (21.41 Mo)
Télécharger le fichier
Dragicevic_2013_VSI_Poster.pdf (46.88 Mo)
Télécharger le fichier
Dragicevic_2013_VSI_PosterNoFrame.pdf (43.84 Mo)
Télécharger le fichier
Origine : Fichiers produits par l'(les) auteur(s)
Format : Figure, Image
Loading...